Iron Status in Preschool Children in Kerala
Original Research
Corresponding Author: Dr. Jijo Joseph John, Assistant Professor, Department of Pediatrics, Believers Church Medical College Hospital, St. Thomas Nagar, Kuttapuzha, Tiruvalla, Kerala 689103 mobile: 09768043348 ,Fax- 04692742818 ,E-mail address – dr.jijojj@gmail.com
Received: 23rd March, 2019 Reviewed: 18th June,2019, Accepted :25th June, 2019.
Citation of article: John Jijo J., Mohan Girija, K.Ajitha, David Alice. Iron Status in Preschool Children. New Indian Journal of Paediatrics, 2019; 8.2.
Original Research
![]()
Abstract: Iron deficiency is associated with impaired psychomotor and neurocognitive development as well as impaired immune function in children and often these consequences are irreversible. Identifying population groups at risk for nutritional iron deficiency at various stages of deficiency will enable proper allocation of resources and manpower.
Aims: To determine the prevalence, risk factors (age, gender and nutrition status) of iron deficiency (iron deficient erythropoiesis and iron deficiency anaemia) in apparently healthy preschool children (6 to 59 months) belonging to affluent families.
Settings and Design: A cross-sectional study conducted in a private teaching hospital.
Methods and Material: 160 children aged 6 to 59 months, belonging to the upper middle class, who came to the pediatric outpatient department for routine visits over a period of 1 year were evaluated. Socio-Demographic data with hemoglobin, red cell indices and iron studies of blood samples were estimated.
Statistical analysis used: Continuous data were described as mean and standard deviation. Odds ratio with 95% confidence interval was calculated using polytomous logistics regression.
Results: Among the 160 children evaluated 48(30%) were anemic, of which 41(85.4%) had IDA, however of the remaining non anemic 60 (53.6%) had IDE, making a total of 101(63.1%) children having ID.Both IDA (p=0.84) and IDE (p=0.32) were equally distributed among boys and girls. Similarly, IDA (p=0.75) & IDE (p=0.17) among the well-nourished was not significantly different from those moderately nourished. Compared to those who had no iron deficiency at all, those who had IDA were more likely to be children below the age of 2 years (OR 6.8 95% CI 2.6-17.7), irrespective of gender and nutrition. However,IDE was spread-out equally by age, gender and nutritional status. RDW is a good indicator for IDA when compared to TIBC, MCV, MCH and MCHC. Unfortunately, none of the above could differentiate IDE from normal subjects.
Conclusions: Despite National Iron Plus Programme, a very high prevalence of iron deficiency even among apparently healthy children from affluent families is of great concern and further interventions need to be planned.There is an urgent need for an improved selection and standardization of iron status indicators which are cheaper and can differentiate all stages of iron deficiency.
Key-words: Iron Deficiency, Iron Deficiency, Erythropoiesis, Anaemia, Pre-School Children, Socioeconomic status, affluent families
Introduction:
Iron is the most common single-nutrient deficiency among children in the developing countries. In the state of Kerala the prevalence of anemia (Hb<11g/dl) is 35.5% among urban children aged 6-59 months, as per National Family Health Survey 2015-16 (NFHS-4).1 The most common cause of anemia in India among preschool children is nutritional iron deficiency (IDA). Iron deficiency (ID) causes changes to brain function and structure, which may be irreversible even with iron treatment, particularly if it happens during infancy when neurogenesis and differentiation of different brain regions are occurring.2The National Iron Plus Initiative which has existed since 2013 is aimed at providing universal iron supplementation for preschool children to overcome such deficiencies. However, identifying population groups at risk for nutritional iron deficiency at various stages of deficiency will enable proper allocation of resources and manpower. Although the prevalence of iron deficiency without anemia is expected to be equal to that of IDA3 no such study has been done in Kerala.
Subjects and Methods:
This was a cross-sectional study conducted in a private teaching hospital for a period of 1 year. To assess iron status in children aged 6 to 59 months, belonging to the upper middle class, we evaluated 160 patients who came to the pediatric outpatient department for routine visits over a period of 1 year. Children who had low birth weight or were preterm, were severely sick, required frequent blood transfusion, were on hematinics, had bleeding disorders, had malignancy or had a history of surgery within the last 2 months were excluded from the study. Only children whose parents were of upper middle class and above as per the Kuppuswamy’s socioeconomic status scale revised for 2018 using real-time update tool, were enrolled for the study.4 The parent/care taker of the child was well informed about the study and written, informed consent was taken from them prior to sampling. Ethical approval for the study was taken from our Institutional Review Board. Nutritional status was assessed through weight for height using an electronic weighing scale. WHO growth charts were used to determine the nutritional status as normal nutrition, moderate acute malnutrition or severe acute malnutrition. The data was compiled as per age group, gender and nutritional status (weight for height).
For serum collection, blood (3 mL) was collected into trace mineral–free SST (Vacutainer; Becton Dickinson, Plymouth, United Kingdom) and allowed to coagulate (25 min) at room temperature. The coagulated blood was centrifuged at 1315 x g for 15 min at 25 °C. Serum was divided into aliquots for the measurement of Iron, ferritin, and transferrin saturation. Venous whole blood (3 mL) was collected into EDTA-containing tubes (Vacutainer) for automated blood analysis. Samples were run on the DXH 600 (Beckman coulter) within 1 h of collection. Complete blood count which includes hemoglobin, red blood cell count, white blood cell count, platelet count and red cell indices, i.e. MCV, MCH, MCHC and RDW was obtained. Serum Iron & UIBC with spectrophotometry in Beckman Coulter AU 680. TIBC is calculated by adding Iron and UIBC. The percentage of transferrin saturation was subsequently calculated as (serum iron/TIBC) x 100.5 Laboratory test results help stage iron deficiency anemia.Stage 1 is characterized by decreased bone marrow iron stores; hemoglobin (Hb) and serum iron remain normal, but the serum ferritin level falls to < 20 μg/mL.Ferritin levels, as it is an acute phase reactant and expensive, was not done.During stage 2, erythropoiesis is impaired.Erythropoiesis is impaired when serum iron falls to < 50 μg/dL and transferrin saturation to < 16% (Iron Deficient Erythropoiesis – IDE).Patients were considered to have iron deficient anemia if the following criteria were fulfilled—serum iron less than 50 μg/dL, transferrin saturation less than 16 % and hemoglobin less than 11 gm%6. Severity of anemia was classified based on WHO classification of anemia. Mild 10 – 10.9 mg/dL, moderate 7 – 9.9 mg/dL, severe < 7 mg/dL.7
Statistical Analysis:
Data was analyzed using SAS University Edition. Data were summarized in frequency tables and a pie chart. Continuous data were described as mean and standard deviation. Tests of proportion were done. Odds ratio with 95% confidence interval was calculated using polytomous logistics regression.
Results:
Among the 160 children evaluated 48(30%) were anemic, of which 41(85.4%) had IDA, however of the remaining non-anemic60 (53.6%) had IDE, making a total of 101(63.1%) children having low iron status. This is shown in Figure 1.The demographic profile and nutritional status of the study population is described in Table 1.
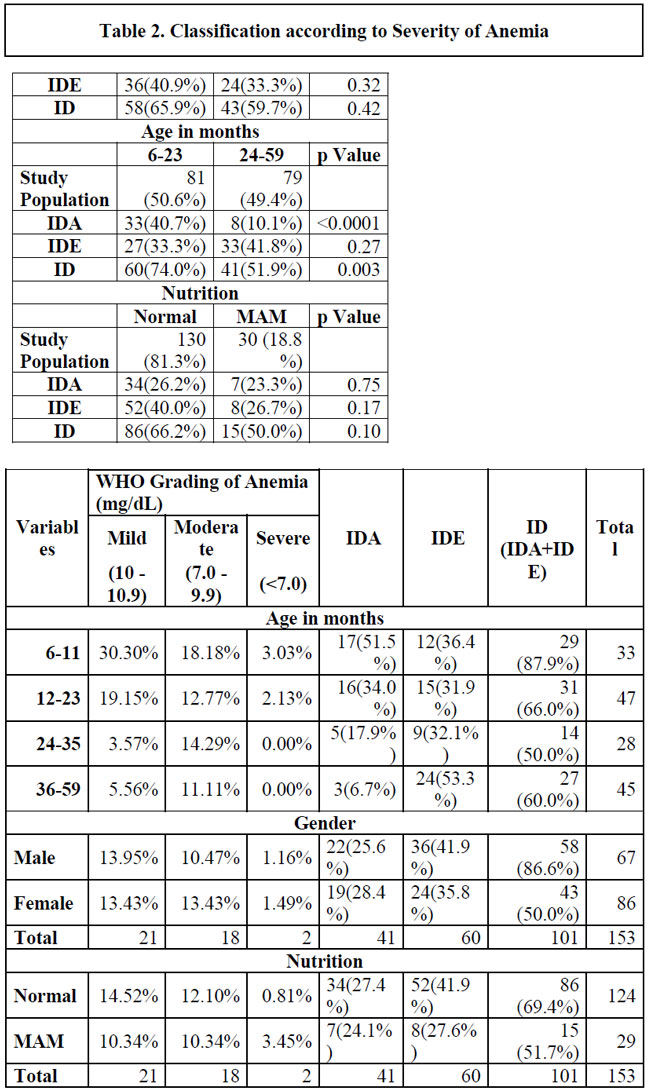
The prevalence of IDA and IDE among children under 2 years was 40.7% and 33.3% respectively. The study population had an equal number of those below 2 years of age and those above. However, proportion of IDA among 2-yearchildren was significantly much more than among the older children (p<0.0001) but this concentration in a younger age group was not seen for IDE (p=0.27).
There were more boys (55.0%) than girls in the study population. However, both IDA with 26.4% of the girls vs. 25% of the boys (p=0.84) and IDE with 33.3% of the girls vs 40.9% of the boys (p=0.32) were equally distributed among boys and girls. Similarly, although a majority (81.2%) of the children belonged to normal nutritional category and a few to moderate acute malnutrition category with no cases of severe acute malnutrition, those with IDA among the well-nourished was not significantly different from those moderately nourished (p=0.75). This was the case with IDE too, (p=0.17).
Severity of IDA and its relationship to age, gender and nutrition is described in Table 2. There were 51.2% mild, 43.9% moderate and only 4.9% severe iron deficient anemics.
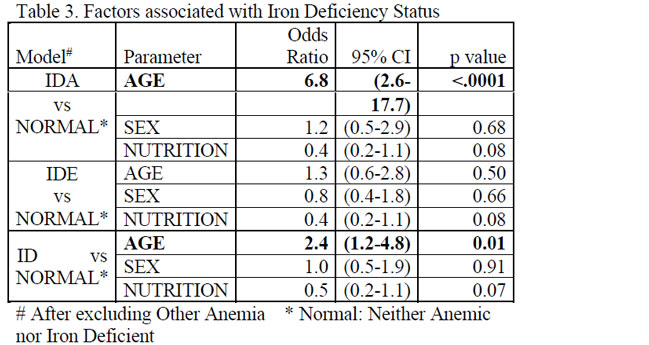
As shown in Table 3, compared to those who had no iron deficiency at all, those who had IDA were more likely to be children below the age of 2 years (OR 6.8 95% CI 2.6-17.7), irrespective of gender and nutrition. However, IDE was spread-out equally by age, gender and nutritional status.When the two were combined as ID, the likelihood of being below the age of 2 decreased but remained significant at (OR 2.4 95% CI 1.2-4.8).
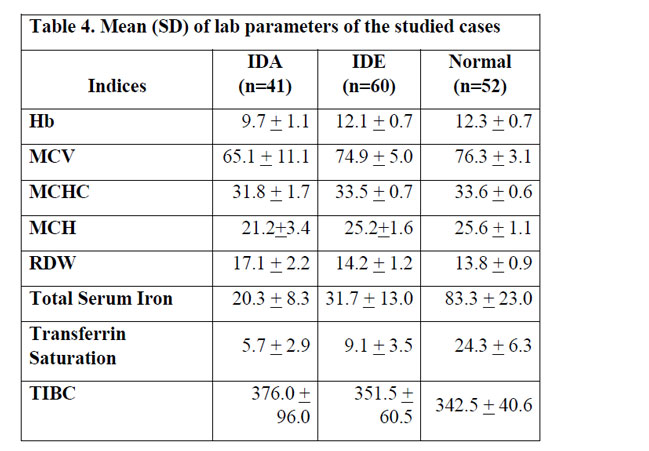
As seen in Table 4, the mean (SD) of RDW showed a clear separation between IDA and normal children when compared to TIBC, MCV, MCH and MCHC. Unfortunately, none of the above could differentiate IDE from normal subjects.


Discussion:
ID and IDA are associated with impaired psychomotor and neurocognitive development as well as impaired immune function in children and often these consequences are irreversible.8,9ID affects neuronal energy metabolism, the metabolism of neurotransmitters, myelination, and memory function. These would explain the behavioural findings in human infants that have been associated with ID.10,11Many studies have demonstrated an association between IDA in infancy and later cognitive deficits. Lozoff et al12,13 have reported detecting cognitive deficits 1 to 2 decades after the iron deficient insult during infancy. A Cochrane systematic review, in which the question of whether treatment of IDA improved psychomotor development was examined, stated that there was inconclusive but plausible evidence (only 2 randomized controlled trials) demonstrating improvement, if the treatment extended for more than 30 days.14 Thus, considering that iron is the world’s most common single-nutrient deficiency, it is important to minimize IDA and ID especially among infants and toddlers.
Anemia has been used as a proxy for iron deficiency because hemoglobin is the only indicator that is measured in most developing countries. A recent systematic review of 10 studies and 2 national reports, on prevalence of anemia that ranged from 12% to 95% in children of Kerala, over 25 years,15did not include any study specifically on IDA or ID in young children of Kerala. Moreover, a recent national survey reported that despite a substantial declining trend over the last few decades, the current prevalence of anemia in Kerala is still high, affecting one in every three children under five years of age.1
A clearer picture of the ID scenario can be revealed by iron studies and can be classified by severity. The mildest form is characterized by a reduced (“inadequate”) iron store (low serum ferritin (SF)) with no impairment in iron delivery to the functional compartment. The next stage, mild functional ID (also called iron-deficient erythropoiesis, IDE) is characterized by a difference between the rate of delivery of absorbed iron and iron released from the stores and the cellular requirements (reduced serum iron (SI)), increased total iron binding capacity (TIBC), reduced percentage saturation of transferrin (% Sat), increased plasma transferrin receptor concentration (TfR) and increased red blood cell zinc protoporphyrin. In the final stage there is evidence of a deficiency in the major functional compartment, the circulating red blood cell mass, established functional ID, also called iron deficiency anemia (IDA). Iron-deficient red blood cells reveal evidence of inadequate hemoglobin synthesis (reduced red blood cell size measured as mean corpuscular volume (MCV) and hemoglobin content, measured as mean corpuscular hemoglobin (MCH)).16
Surprisingly, our study, though comprising only of apparently healthy children of high socioeconomic status who have access to healthcare and nutritious food, showed that ID is a major public health problem affecting101(63.1%) children, wherein 41(25.6%) children had IDA and the remaining had IDE. Mild ID, also known as reduced iron store was not studied because of the cost involved. Including this category would have increased the proportion of iron deficiency even more.Such high proportion of IDA and IDE even among children from affluent families is of great concern.
Apart from theincreased requirement during the rapid growth stage of infancy and early childhood, between six and twenty-three months, inadequate intake of iron when compared to the need is the major cause of this deficiency. In Kerala, a cereal based diet is consumed regularly which unfortunately, decreases iron bioavailability because the phytates in grains sequester iron to a poorly absorbable complex.17 Meat, fish and poultry are rich sources of bio available iron. Plant sources of iron are generally less well absorbed. However, including “enhancers” such as the organic acids citric, malic or ascorbic acid (i.e. vitamin C) may improve the absorption of iron from these foods.18 In addition, adding heme iron from animal-source foods (especially from beef, but also from lamb, pork, liver and chicken) to foods containing non-heme iron will also increase the overall bioavailability and absorption of iron from a meal.19 Methods of food processing – such as soaking, fermentation, germination or thermal or mechanical processing – can also improve the bioavailability and absorption of iron.20 Finally, avoiding combination of known inhibitors of non-heme iron – such as tea or coffee – with meals will improve iron absorption.19 A combination of strategies – increasing iron-rich foods in the diet, adding “enhancers”, avoiding “inhibitors” and exploiting beneficial processing techniques – will be the best approach for improving iron status. At the population level, however, it would be much easier to reduce iron deficiency by food fortification of various foods, including corn flour, salt and rice, especially in developing countries. However, universal food fortification for all ages is problematic, given the possible adverse effects of iron in certain subsets of older children and adults.
Our study showed that female children are no different than male children in their susceptibility to IDA(p=0.84) or IDE(p=0.32), unlike other studies of anemia such as the one by George et al, 8 where females (12.6%) were significantly more susceptible to anemia than males (10.25%); and the one by Manoj et al where male (17.27%) children were more susceptible than female (32.5%) children. Majority of the children in our study had a normal nutritional status (81.2%) based on weight for height. 83% of IDA and 86.7% of IDE belonged to the normal category and only 17% of IDA and 13.3% of IDE had moderate acute malnutrition. Though a lower nutritional status has been associated with a higher incidence of anemia,21-23 we did not find any such association in our study group for either for IDA(p=0.75) or for IDE(p=0.17).
Majority (74.0%) of the children below 2 years had ID. This was even higher among infants (87.9%). The prevalence of IDA and IDE among children under 2 years was 40.7% and 33.3% respectively. Among children aged 2-5 years only 10.1% had IDA, while 41.8% had IDE. The most affected age group with IDA is infants (51.5%) and the least affected is between age group of 36 – 60 months (6.7%) similar to the studies like Arlappa et al, Manoj et al.21,23 Children across all ages had IDE and though IDA was less among 36 – 60 months, 53.3%of them had IDE. Children below the age of 2 years were more likely to have IDA (OR 2.4 95% CI 1.2-4.8) for any given gender or nutritional status, when compared to those above the age of 2 years. However, IDE was equally distributed, irrespective of age, gender or nutritional status.
Our results confirm that ID among young children in Kerala remains a major public health concern. A high prevalence among apparently healthy children from affluent families is an indicator that the general population rates will be even higher.
As per the WHO/UNICEF guidelines of 2016 recommendations, a universal supplementation is required and it is not cost-effective to screen children for anemia, when the prevalence of anemia is above 40%.24AAP recommends that exclusively breastfed term infants receive an iron supplementation of 1 mg/kg per day, starting at 4months of age and continued until appropriate iron-containing complementary foods have been introduced. Children from 1 to 3 years of age should have an iron intake of 7mg/ day. For children not receiving this iron intake, liquid supplements can be used for children 12 through 36 months of age, and chewable multivitamins that include an iron component for children 3 years and older. Other options include, iron supplements in the form of iron sulphate drops or Iron sprinkles with or without additional zinc. AAP recommends universal screening for anemia at approximately at 12 months of age with determination of Hb concentration and an assessment of risk factors associated with ID/IDA.25
Barriers to adequate iron supplementation are lack of education for care providers and patients, poor compliance made worse by the perception of adverse effects, including nausea, vomiting, constipation, stomach upset, and teeth staining, cost, poor acceptance of supplemental nutrition programs and risk of iron overload. Although the present study is not a population-based study, the chosen study population can be considered as representative of a high socioeconomic group. Moreover, although it was not designed specifically to study all the risk factors for iron deficiency, it clearly shows that children under 2 years are at highest risk for IDA and all children are at risk for IDE irrespective of age, gender and nutritional status. This highlights the need to plan further intervention trials with either iron rich or iron fortified foods or iron supplementation, especially among children below the age of two. Under National Iron Plus Initiative launched in 2013, bi-weekly 20 mg elemental iron and 100 microgram (mcg) folic acid per ml of liquid formulation and age appropriate de-worming for preschool children of 6-59 months is given. Despite such national programs, a high prevalence of ID is alarming. The efficacy of any program for minimizing ID and IDA can be tracked scientifically and evaluated through well planned surveillance programs.
There is an urgent need for an improved selection and standardization of iron status indicators which are cheap and can differentiate all stages of iron deficiency. The mean (SD) of RDW showed a clear separation between IDA and normal children when compared to TIBC, MCV, MCH and MCHC. Similar studies in other settings support the usage of RDW as a screening tool for identifying iron deficiency anemia.26,27 The sensitivity of RDW in detecting iron deficiency anemia is very high (96 -100%).28 Unfortunately, none of the above could differentiate IDE from normal subjects.
Key Messages: The prevalence of iron deficiency among preschool children was very high (63.1%), even among affluent families.IDA among 2-yearold children was significantly much more than among the older ones while IDE was spread-out equally among all ages.
References:
1. International Institute of Population Sciences. State Fact sheet-Kerala, National Family Health Survey-4 2015-2016. Mumbai.
2. Haider BA, Olofin I, Wang M, et al. Anaemia, prenatal iron use, and risk of adverse pregnancy outcomes: systematic review and meta-analysis. BMJ. 2013;346:f3443.
3. Organization WH. Iron deficiency anemia. assessment, prevention, and control. A guide for programme managers. 2001:47-62.
4. Sharma R. Online interactive calculator for real-time update of the Kuppuswamy’s socioeconomic status scale. In:2016.
5. Burtis CA, Ashwood ER, Bruns DE. Tietz Textbook of Clinical Chemistry And Molecular Diagnostics-e-book. Elsevier Health Sciences; 2012.
6. Braunstein EM. Iron Deficiency Anemia In: MSD Manual Professional Version. Kenilworth, NJ, USA: Merck & Co., Inc.; 2018.
7. Organization WH. Nutritional anaemias: tools for effective prevention and control. 2017.
8. Walter T. Effect of iron-deficiency anemia on cognitive skills and neuromaturation in infancy and childhood. Food and Nutrition Bulletin. 2003;24(4_suppl2):S104-S110.
9. Pasricha S-R, Hayes E, Kalumba K, Biggs B-A. Effect of daily iron supplementation on health in children aged 4–23 months: a systematic review and meta-analysis of randomised controlled trials. The Lancet Global Health. 2013;1(2):e77-e86.
10. Georgieff MK. The role of iron in neurodevelopment: fetal iron deficiency and the developing hippocampus. In: Portland Press Limited; 2008.
11. Tran PV, Fretham SJ, Carlson ES, Georgieff MK. Long-term reduction of hippocampal brain-derived neurotrophic factor activity after fetal-neonatal iron deficiency in adult rats. Pediatric Research. 2009;65(5):493.
12. Lozoff B, Jimenez E, Smith JB. Double burden of iron deficiency in infancy and low socioeconomic status: a longitudinal analysis of cognitive test scores to age 19 years. Archives of Pediatrics & Adolescent Medicine. 2006;160(11):1108-1113.
13. Lozoff B, Jimenez E, Hagen J, Mollen E, Wolf AW. Poorer behavioral and developmental outcome more than 10 years after treatment for iron deficiency in infancy. Pediatrics. 2000;105(4):e51-e51.
14. Martins S, Logan S, Gilbert RE. Iron therapy for improving psychomotor development and cognitive function in children under the age of three with iron deficiency anaemia. Cochrane Database of Systematic Reviews. 2001(2).
15. Rakesh PS. Prevalence of Anaemia in Kerala State, Southern India – A Systematic Review. J Clin Diagn Res. 2017;11(5):LE01-LE04.
16. Lynch S. The rationale for selecting and standardizing iron status indicators. World Health Organization Report: Priorities in the assessment of vitamin A and iron status in populations, Panama City, Panama. 2010:15-17.
17. Camaschella C. Iron-Deficiency Anemia. N Engl J Med. 2015;373(5):485-486.
18. Allen LH. To what extent can food-based approaches improve micronutrient status? Asia Pacific Journal of Clinical Nutrition. 2008;17(S1):103-105.
19. Tontisirin K, Nantel G, Bhattacharjee L. Food-based strategies to meet the challenges of micronutrient malnutrition in the developing world. Proceedings of the Nutrition Society. 2002;61(2):243-250.
20. Hotz C, Gibson RS. Traditional food-processing and preparation practices to enhance the bioavailability of micronutrients in plant-based diets. The Journal of Nutrition. 2007;137(4):1097-1100.
21. Manoj S, Meppadath IM. Anaemia in 6-59 months children in rural Kerala and its association with age, gender, nutritional status and dietary habits. Journal Of Evolution of Medical and Dental Sciences-JEMDS. 2017;6(29):2358-2361.
22. Saluja N, Garg S, Chopra H, Bajpai S. Socio-Demographic factors affecting anaemia in school children in urban area of Meerut, India. The Internet Journal of Preventive Medicine. 2011;1(1):10.5580.
23. Arlappa N, Balakrishna N, Laxmaiah A, Brahmam GN. Prevalence of anaemia among rural pre-school children of West Bengal, India. Ann Hum Biol. 2010;37(2):231-242.
24. World Health Organization. Nutrition for Health and Development, World Health Organization. Guideline. Daily iron supplementation in infants and children. In: Geneva: World Health Organization,; 2016: http://www.ncbi.nlm.nih.gov/books/NBK362032/.
25. Baker RD, Greer FR. Clinical Report—Diagnosis and prevention of iron deficiency and iron-deficiency anemia in infants and young children (0–3 years of age). Pediatrics. 2010:peds. 2010-2576.
26. McClure S, Custer E, Bessman JD. Improved detection of early iron deficiency in nonanemic subjects. Jama. 1985;253(7):1021-1023.
27. Dasgupta A, Hegde C, Mistri R. Red-cell distribution width as a measure of severity of iron-deficiency in iron-deficiency anemia. Indian Journal of Medical Research. 1994;100:177-183.
28. Bessman JD, Gilmer JR PR, Gardner FH. Improved classification of anemias by MCV and RDW. American Journal of Clinical Pathology. 1983;80(3):322-326.
Issue: April – June 2019 [Volume 8.2]